Project 2 · Earth science and climate
How deep does summer go?
Dig down far enough and it is winter in summer. Measure how far, using real climate data.
- Math
- Algebra II, trigonometry, logarithms
- You need
- A laptop and free public data
- Tools
- Python or a spreadsheet; public climate data
- Solver
- Heat, 1D
The question
Seasonal temperature swings fade and arrive later as you go underground. From real sensor data, what is your soil's thermal diffusivity, and how does it change with wetness or with the site?
Objectives
Twelve weeks, in the four stages every TopEdu project follows. Your mentor reviews each checkpoint before you move on.
Weeks 1 to 3
Learn to trust the model
Run 02_soil_temperature.py until its CHECK line says PASS, and explain every line of it to your mentor. Then reproduce a known answer: The model has an exact answer: amplitude falls as e^(−z/d) and the delay grows as z/d, with d = √(2κ/ω).
Checkpoint: you reproduce a known answer and report how close you got.
Weeks 4 and 5
Ask your own question
Narrow the question above to one sentence that could turn out to be wrong, and write your prediction before you run anything. The first experiments below are a place to start.
Checkpoint: a one-page plan with your question and prediction.
Weeks 6 to 9
Run it, then measure the world
Drive the surface with a yearly temperature cycle, measure the amplitude and the delay at each depth, and fit the diffusivity to data from a real station. Then step away from the screen: download free soil temperatures at 5 to 100 cm from NOAA's U.S. Climate Reference Network and compare stations with different soils.
Checkpoint: one chart comparing your model with reality.
Weeks 10 to 12
Explain the gap, and share it
Work out why your model and your measurements disagree, test at least one explanation, and write it up yourself. Say which numbers came from the starter and which from the lab. Keep the honest limit in view: soil is one uniform layer here, so a mismatch at some depths is itself a finding to explain: layers or moisture may be the cause.
Checkpoint: a final paper, your code and a ten-minute talk.
The data
What the lab lets you change, how the project was checked before we listed it, and what the starter prints on a laptop.
Settings in the online lab
| Setting | Range | Starts at |
|---|---|---|
| Thermal diffusivity | 5 to 40 m²/year | 15.8 |
| Surface swing | 2 to 25 °C | 10 |
Checked on the research solver
| Solver (Heat, 1D) | largest error against the exact solution over a year: 1.44e-3 °C; swing at depth 2.24 m reaches 3.58 °C over 8 frames |
|---|---|
| Known answer | amplitude 10 °C at the surface, 3.68 °C at one damping depth |
| Error | 0.01% (limit 1.00%): passed |
What the starter prints
From the run that built this page. Timings depend on your computer; the CHECK line must say PASS.
largest error over the year: 1.97e-03 degrees C (0.020% of the swing)
CHECK whole year against the exact answer -> PASS (limit 1% of the swing)
  depth 0.05 m: swing  9.78 C,   1.3 days behind the surface
  depth 0.10 m: swing  9.56 C,   2.6 days behind the surface
  depth 0.20 m: swing  9.15 C,   5.1 days behind the surface
  depth 0.50 m: swing  8.00 C,  13.0 days behind the surface
  depth 1.00 m: swing  6.40 C,  25.9 days behind the surface
kappa from shrinking: 15.81   kappa from lag: 15.73   (the model used 15.8)
damping depth d = 2.24 m: below about 3d = 6.7 m the year is almost invisible
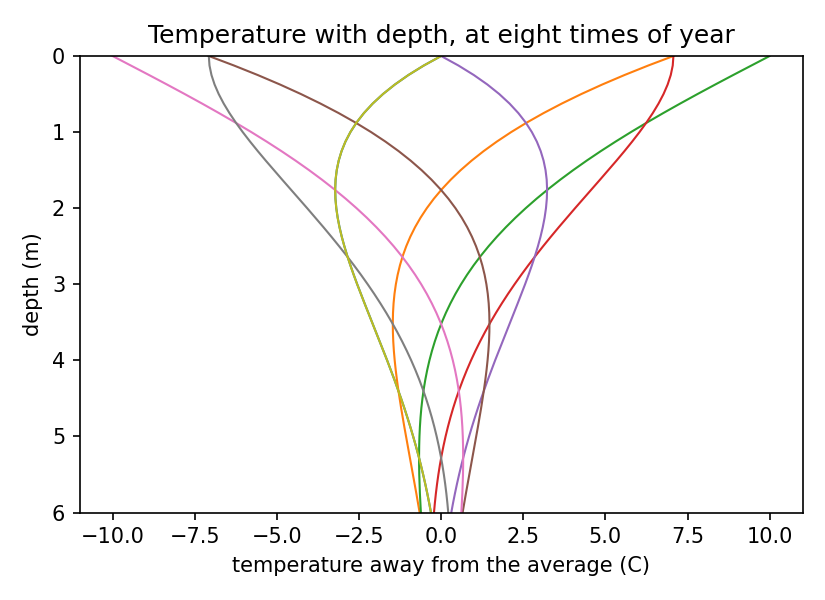
The starter code
One Python file that needs only numpy and matplotlib. Run python3 02_soil_temperature.py --show to see the plots. How to set up.
The model
The ground's surface warms and cools once a year. Underground the swing gets smaller and arrives later. How much smaller, and how much later, tells you the soil's thermal diffusivity (kappa).
Units: depth in metres, time in years, temperature in degrees C away from the yearly average. Run: python 02_soil_temperature.py [--show] or python 02_soil_temperature.py my_station.csv Needs: numpy and matplotlib
What it does
- Stage 1: run this file. It steps the heat equation through one year in a 20 m column of soil, driven by a yearly cycle at the surface, and compares the whole field with the exact answer. The CHECK line should say PASS.
- Stage 2: fit kappa from temperatures at several depths, first from the model, then from a real station.
Your first experiments
From the YOUR TURN list at the bottom of the file. Write your prediction in your log before you run each one.
- Predict first: if the soil were twice as diffusive (wet), how much deeper would the 1 C swing reach? Then run with KAPPA = 31.6 and check.
- Download two years of soil temperatures from a USCRN station, put them in the simple CSV layout described in read_station, and run: python 02_soil_temperature.py my_station.csv
- Compare two stations with different soils or rainfall. Do "kappa from shrinking" and "kappa from lag" agree? If not, why might a real soil break this one-layer model?
Download 02_soil_temperature.pyAll ten (.zip)Instructions (PDF)
The real world
Download free soil temperatures at 5 to 100 cm from NOAA's U.S. Climate Reference Network and compare stations with different soils.
The honest limit
Soil is one uniform layer here, so a mismatch at some depths is itself a finding to explain: layers or moisture may be the cause.
Want to work on this one?
Members run it on the research solver in the lab and choose a mentor to guide them.