Project 7 · Physics and music
Why a plucked note changes as it fades
A guitar note changes as it fades. Capture that on your phone and explain what the simple model misses.
- Math
- Algebra II, trigonometry, logarithms
- You need
- A guitar or a home-made string, and a phone
- Tools
- Guitar or a home-made monochord, phone, Python
- Solver
- Telegraph, 1D
The question
This damping model makes every harmonic fade at one rate. In a real guitar the upper harmonics die sooner. By how much, and how does it depend on the string's material and gauge?
Objectives
Twelve weeks, in the four stages every TopEdu project follows. Your mentor reviews each checkpoint before you move on.
Weeks 1 to 3
Learn to trust the model
Run 07_damped_string.py until its CHECK line says PASS, and explain every line of it to your mentor. Then reproduce a known answer: Each mode has the exact solution e^(−at/2) times an oscillation at √(ω² − a²/4).
Checkpoint: you reproduce a known answer and report how close you got.
Weeks 4 and 5
Ask your own question
Narrow the question above to one sentence that could turn out to be wrong, and write your prediction before you run anything. The first experiments below are a place to start.
Checkpoint: a one-page plan with your question and prediction.
Weeks 6 to 9
Run it, then measure the world
Fit the damping from a recording, simulate the same note, and measure where the single-rate model departs from the data for each harmonic. Then step away from the screen: record plucked strings on a phone and measure each harmonic's decay on a spectrogram.
Checkpoint: one chart comparing your model with reality.
Weeks 10 to 12
Explain the gap, and share it
Work out why your model and your measurements disagree, test at least one explanation, and write it up yourself. Say which numbers came from the starter and which from the lab. Keep the honest limit in view: one constant damping term cannot describe a real string. Showing exactly how it fails, and proposing a fix, is the result.
Checkpoint: a final paper, your code and a ten-minute talk.
The data
What the lab lets you change, how the project was checked before we listed it, and what the starter prints on a laptop.
Settings in the online lab
| Setting | Range | Starts at |
|---|---|---|
| Note frequency | 40 to 440 Hz | 82.4 |
| Damping | 0.1 to 8 1/s | 1 |
Checked on the research solver
| Solver (Telegraph, 1D) | largest error against the exact solution over 8 frames: 7.05e-4 |
|---|---|
| Known answer | exact damped two-mode solution, amplitude 1.3 |
| Error | 0.05% (limit 1.00%): passed |
What the starter prints
From the run that built this page. Timings depend on your computer; the CHECK line must say PASS.
after four periods: largest error along the string 3.04e-06 (pluck size 1.3)
CHECK string against the exact damped answer -> PASS (limit 1% of the pluck)
each harmonic's fade in the model (strength ~ e^(-rate t)); the model says every rate is a/2 = 0.5
  harmonic 1 (  82.4 Hz): rate 0.500 per second
  harmonic 2 ( 164.8 Hz): rate 0.500 per second
  harmonic 3 ( 247.2 Hz): rate 0.500 per second
  harmonic 4 ( 329.6 Hz): rate 0.500 per second
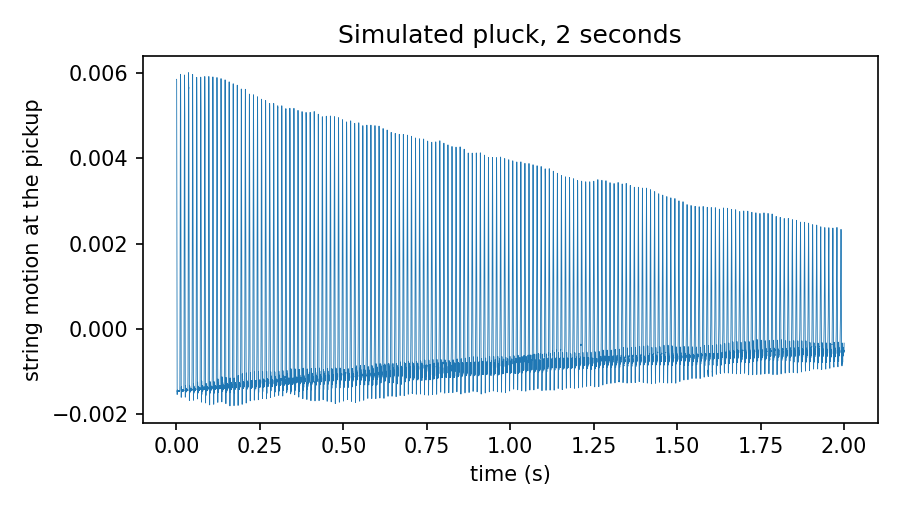
The starter code
One Python file that needs only numpy and matplotlib. Run python3 07_damped_string.py --show to see the plots. How to set up.
The model
A string of length L vibrates as u_tt + a u_t = c^2 u_xx, fixed at both ends. The term a u_t is a simple drag. In this model every harmonic fades as e^(-a t / 2), all at the same rate. A real guitar loses its high harmonics sooner, so the sound gets mellower as it fades. Measuring by how much is the research.
What it does
- Stage 1: run this file. It plucks a low E string (82.4 Hz), steps it for four periods, and compares the whole string with the exact answer. Then it measures each harmonic's fade from the simulated sound. The CHECK line should say PASS.
- Stage 2: record real strings, measure each harmonic's fade the same way, and show where one damping rate fails.
Your first experiments
From the YOUR TURN list at the bottom of the file. Write your prediction in your log before you run each one.
- Record one plucked string on a phone (a quiet room, 3 seconds, saved as .wav). Set F to its note and run: python 07_damped_string.py my_pluck.wav
- Plot rate against harmonic number. One a cannot fit it. Try rate = b0 + b2 * k^2. Does that fit better?
- Compare a wound and a plain string, or nylon and steel. Which loses its high harmonics fastest?
- Then fix the model: what term would make high harmonics fade faster? (Hint: a drag on u_xxt.)
Download 07_damped_string.pyAll ten (.zip)Instructions (PDF)
The real world
Record plucked strings on a phone and measure each harmonic's decay on a spectrogram.
The honest limit
One constant damping term cannot describe a real string. Showing exactly how it fails, and proposing a fix, is the result.
Want to work on this one?
Members run it on the research solver in the lab and choose a mentor to guide them.