Project 3 · Mathematical biology
How small can a nature reserve be?
Why do some species vanish from parks that look big enough? The answer fits in one equation.
- Math
- Algebra II, exponentials, one guided substitution
- You need
- A laptop and published field studies
- Tools
- Python or a spreadsheet; published ecology data
- Solver
- Heat, 2D (with a substitution)
The question
A population grows inside a habitat and is lost when it wanders out. For a fixed area, which rectangle keeps a species alive, and how does the minimum size depend on how far the species roams?
Objectives
Twelve weeks, in the four stages every TopEdu project follows. Your mentor reviews each checkpoint before you move on.
Weeks 1 to 3
Learn to trust the model
Run 03_critical_patch.py until its CHECK line says PASS, and explain every line of it to your mentor. Then reproduce a known answer: For an a by b rectangle the decay rate must match Dπ²(1/a² + 1/b²), which gives the classic critical patch size.
Checkpoint: you reproduce a known answer and report how close you got.
Weeks 4 and 5
Ask your own question
Narrow the question above to one sentence that could turn out to be wrong, and write your prediction before you run anything. The first experiments below are a place to start.
Checkpoint: a one-page plan with your question and prediction.
Weeks 6 to 9
Run it, then measure the world
Write density as u = e^(rt) · v, so v obeys the heat equation. Measure how fast v decays in each shape: the species survives when r beats that decay rate. Then step away from the screen: put measured dispersal and growth rates from published field studies into the model, then compare with the size of a real reserve.
Checkpoint: one chart comparing your model with reality.
Weeks 10 to 12
Explain the gap, and share it
Work out why your model and your measurements disagree, test at least one explanation, and write it up yourself. Say which numbers came from the starter and which from the lab. Keep the honest limit in view: growth is exponential with no crowding, so this predicts whether a species survives, not how large its population becomes.
Checkpoint: a final paper, your code and a ten-minute talk.
The data
What the lab lets you change, how the project was checked before we listed it, and what the starter prints on a laptop.
Settings in the online lab
| Setting | Range | Starts at |
|---|---|---|
| Reserve width | 0.5 to 4 length units | 1 |
| Reserve height | 0.5 to 4 length units | 1 |
| Roaming rate D | 0.2 to 4 area per time | 1 |
Checked on the research solver
| Solver (Heat, 2D (with a substitution)) | 1 x 1: decay rate 19.762; 2 x 0.5: decay rate 41.717 |
|---|---|
| Known answer | 19.739; 41.946 |
| Error | 0.54% (limit 1.00%): passed |
| A first finding | same area, but the long thin reserve needs a growth rate 2.1 times higher to survive |
What the starter prints
From the run that built this page. Timings depend on your computer; the CHECK line must say PASS.
1 x 1 reserve: measured decay rate 19.749, exact 19.739, error 0.05%
   so the species needs a growth rate r > 19.75 to survive here
2 x 0.5 reserve: measured decay rate 42.084, exact 41.946, error 0.33%
   so the species needs a growth rate r > 42.08 to survive here
CHECK decay rates against D pi^2 (1/a^2 + 1/b^2) -> PASS (limit 1%)
  area 1, length/width 1: needs r > 19.74  (1.00 times the square)
  area 1, length/width 1.5: needs r > 21.38  (1.08 times the square)
  area 1, length/width 2: needs r > 24.67  (1.25 times the square)
  area 1, length/width 3: needs r > 32.90  (1.67 times the square)
  area 1, length/width 4: needs r > 41.95  (2.12 times the square)
  area 1, length/width 6: needs r > 60.86  (3.08 times the square)
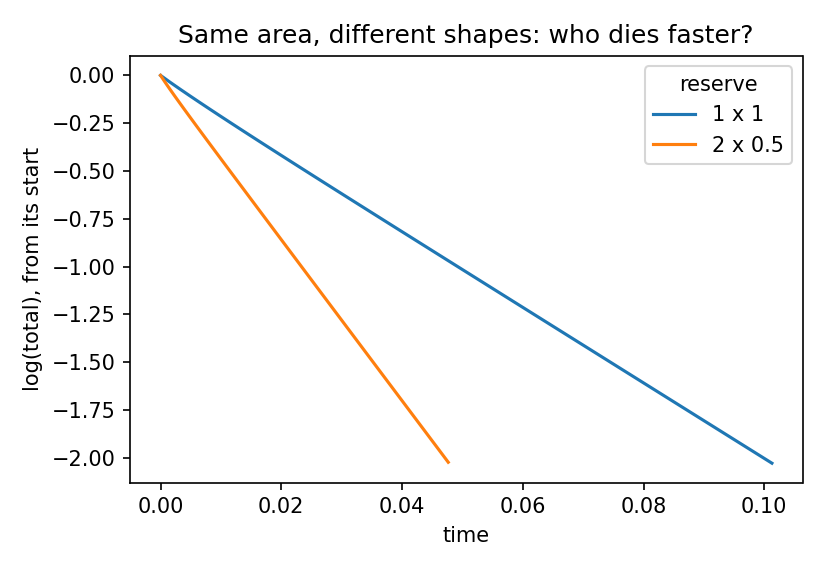
The starter code
One Python file that needs only numpy and matplotlib. Run python3 03_critical_patch.py --show to see the plots. How to set up.
The model
Animals in a rectangular reserve multiply at rate r and wander at rate D. Any that cross the edge are lost. Write the density as u = e^(r t) v. Then v obeys the plain heat equation dv/dt = D laplacian(v) with v = 0 on the edge, and v dies away at some rate lambda. The species survives exactly when r is bigger than lambda.
What it does
- Stage 1: run this file. It measures lambda for a 1 x 1 and a 2 x 0.5 reserve (the same area) and checks both against the exact rate D pi^2 (1/a^2 + 1/b^2). The CHECK line should say PASS.
- Stage 2: use real dispersal and growth rates and ask which shapes of a real reserve would keep a species.
Your first experiments
From the YOUR TURN list at the bottom of the file. Write your prediction in your log before you run each one.
- The list above uses the formula. Check two of its shapes with decay_rate() before you trust it.
- A real species: find published values of D (km^2 per year) and r (per year) for one animal or plant. What is the smallest square reserve that keeps it? Compare with the size of a real reserve.
- Predict, then test: does an L-shaped reserve do better or worse than a square of the same area? (Hint: set v to zero on a corner block every step to cut the L out of a rectangle.)
- Say what the model leaves out: here nothing limits growth, so it tells you "survives or not", not "how many".
Download 03_critical_patch.pyAll ten (.zip)Instructions (PDF)
The real world
Put measured dispersal and growth rates from published field studies into the model, then compare with the size of a real reserve.
The honest limit
Growth is exponential with no crowding, so this predicts whether a species survives, not how large its population becomes.
Want to work on this one?
Members run it on the research solver in the lab and choose a mentor to guide them.