Project 1 · Heat and engineering
Where should the hot chip go?
Your phone throttles when it gets hot. Find out why where the chip sits matters so much.
- Math
- Algebra II, exponentials; Fourier series are met along the way
- You need
- A laptop. Optional: a small metal plate and low-cost thermistors, with an adult
- Tools
- Python or a spreadsheet
- Solver
- Heat, 2D
The question
A hot chip sits on a metal plate cooled along one edge. How much does moving the chip, or spreading its heat, change the peak temperature, and can you predict the best layout for two chips?
Objectives
Twelve weeks, in the four stages every TopEdu project follows. Your mentor reviews each checkpoint before you move on.
Weeks 1 to 3
Learn to trust the model
Run 01_chip_cooling.py until its CHECK line says PASS, and explain every line of it to your mentor. Then reproduce a known answer: Compare the first steady-state runs with the series solution you derive for the plate.
Checkpoint: you reproduce a known answer and report how close you got.
Weeks 4 and 5
Ask your own question
Narrow the question above to one sentence that could turn out to be wrong, and write your prediction before you run anything. The first experiments below are a place to start.
Checkpoint: a one-page plan with your question and prediction.
Weeks 6 to 9
Run it, then measure the world
Sweep the chip position and size, record the peak temperature, then add a second heat source and search for the coolest layout. Then step away from the screen: heat a small aluminium plate with a power resistor, cool one edge in ice water, and read temperatures with low-cost thermistors.
Checkpoint: one chart comparing your model with reality.
Weeks 10 to 12
Explain the gap, and share it
Work out why your model and your measurements disagree, test at least one explanation, and write it up yourself. Say which numbers came from the starter and which from the lab. Keep the honest limit in view: material properties are uniform, so the model cannot represent a plate made of two metals.
Checkpoint: a final paper, your code and a ten-minute talk.
The data
What the lab lets you change, how the project was checked before we listed it, and what the starter prints on a laptop.
Settings in the online lab
| Setting | Range | Starts at |
|---|---|---|
| Chip position, x | 0.15 to 0.85 plate widths | 0.5 |
| Distance from the cooled edge | 0.15 to 0.85 plate widths | 0.5 |
| Chip size | 0.06 to 0.25 plate widths | 0.12 |
Checked on the research solver
| Solver (Heat, 2D) | peak temperature 7.3284 at (0.25, 0.8125) |
|---|---|
| Known answer | series solution 7.3271 |
| Error | 0.02% (limit 1.00%): passed |
| A first finding | moving the chip from 0.7 to 0.2 plate widths from the cooled edge changes the peak from 7.33 to 2.44 |
What the starter prints
From the run that built this page. Timings depend on your computer; the CHECK line must say PASS.
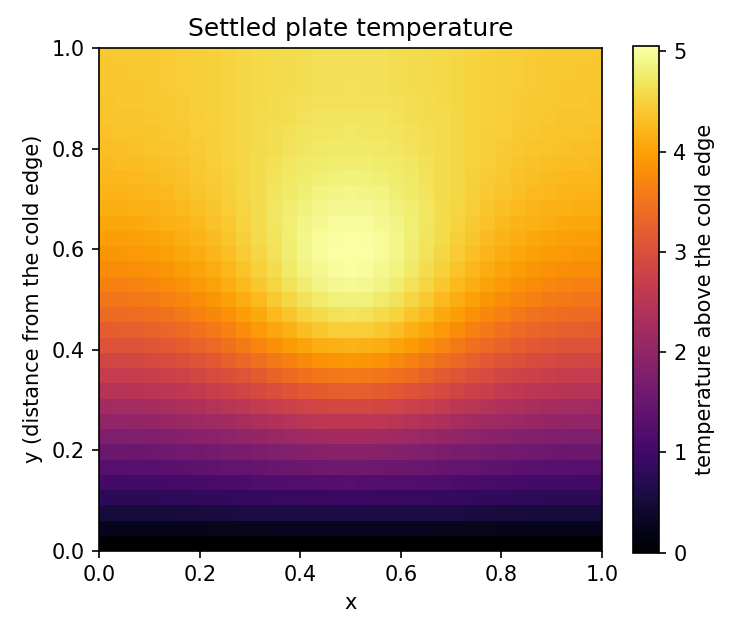
settled after 32248 steps; peak 5.0544 at x = 0.50, y = 0.59
series answer at that point: 5.0495
CHECK peak temperature against the series: error 0.10% -> PASS (limit 1%)
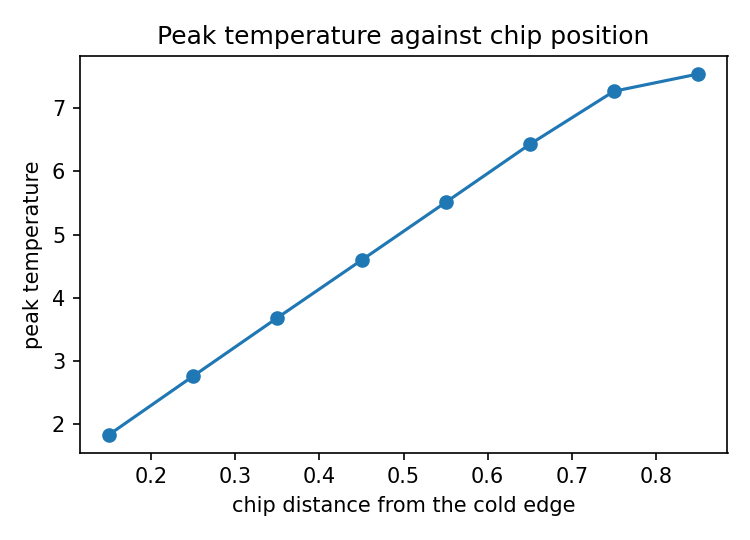
  chip at distance 0.15 from the cold edge: peak 1.837
  chip at distance 0.25 from the cold edge: peak 2.763
  chip at distance 0.35 from the cold edge: peak 3.684
  chip at distance 0.45 from the cold edge: peak 4.595
  chip at distance 0.55 from the cold edge: peak 5.510
  chip at distance 0.65 from the cold edge: peak 6.428
  chip at distance 0.75 from the cold edge: peak 7.267
  chip at distance 0.85 from the cold edge: peak 7.540
The starter code
One Python file that needs only numpy and matplotlib. Run python3 01_chip_cooling.py --show to see the plots. How to set up.
The model
A chip heats a square metal plate. The bottom edge (y = 0) is held cold, the other three edges are insulated. How hot does the plate get, and how much does the chip's position change that?
Units are scaled: the plate is 1 by 1, and temperature is "degrees above the cold edge". Run: python 01_chip_cooling.py (add --show to open the plots in a window) Needs: Python 3 with numpy and matplotlib (pip install numpy matplotlib)
What it does
- Stage 1 (weeks 1 to 3): run this file. It solves the heat equation step by step until the plate settles, then checks the peak temperature against an exact series answer. You should see a CHECK line that says PASS.
- Stage 2 (weeks 4 to 9): change the chip, then answer your own question in the YOUR TURN section at the bottom.
Your first experiments
From the YOUR TURN list at the bottom of the file. Write your prediction in your log before you run each one.
- Write your prediction first: if the chip size doubles with the same total power, does the peak halve? (Hint: to keep the total power fixed, scale POWER by (old size / new size)^2.) Then run it.
- Add a second chip: heat_source(x, y, 0.3, 0.4) + heat_source(x, y, 0.7, 0.6). Search for the two positions with the lowest peak. Is the best layout symmetric? Is it what you guessed?
- Grid check: run with N = 17, 33 and 65. How much does the peak change? Report that in your paper.
- Real world: heat an aluminium plate with a power resistor and cool one edge in ice water. Which of your predictions survive? The gap is the interesting part.
The real world
Heat a small aluminium plate with a power resistor, cool one edge in ice water, and read temperatures with low-cost thermistors.
The honest limit
Material properties are uniform, so the model cannot represent a plate made of two metals.
Want to work on this one?
Members run it on the research solver in the lab and choose a mentor to guide them.